BCU Labs’ New Interactive Crash Map Highlights Why We Need Safer Infrastructure Now
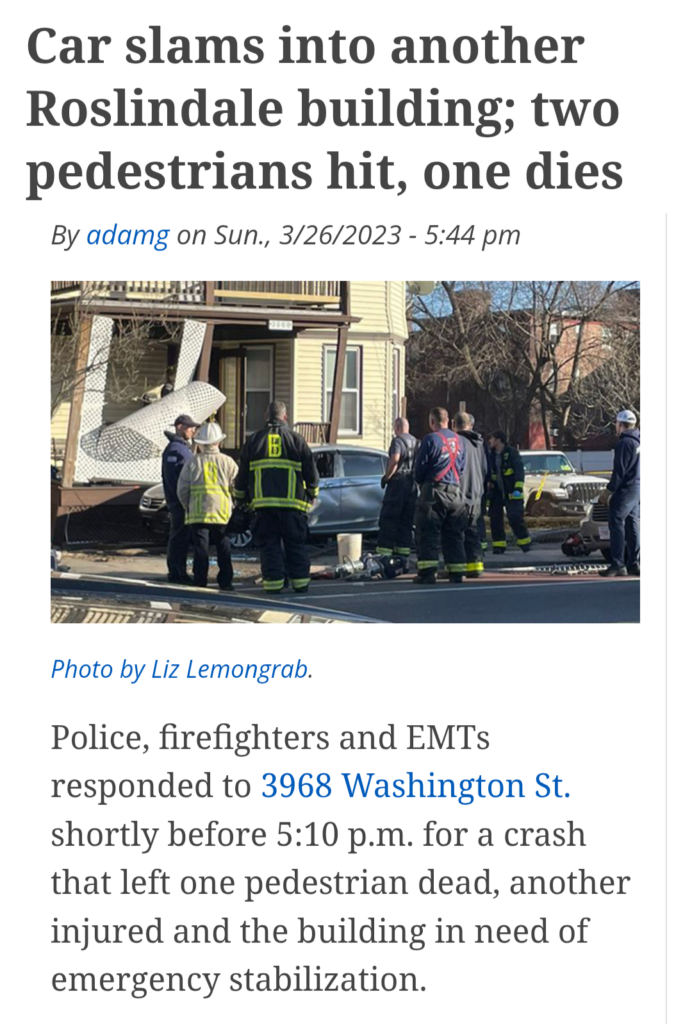
On May 20, 2026, advocates held a “Ride of Silence” in Boston to memorialize the deaths of 38 pedestrians and bikers since Mayor Wu was inaugurated in November 2021. Co-sponsored by Boston Cyclists Union and Walk Massachusetts, a group of bikers gathered at Melnea Cass Boulevard, one of the deadliest areas of the city to pedestrians and bikers, then rode downtown in silence, meeting with other mourners for a vigil at City Hall.
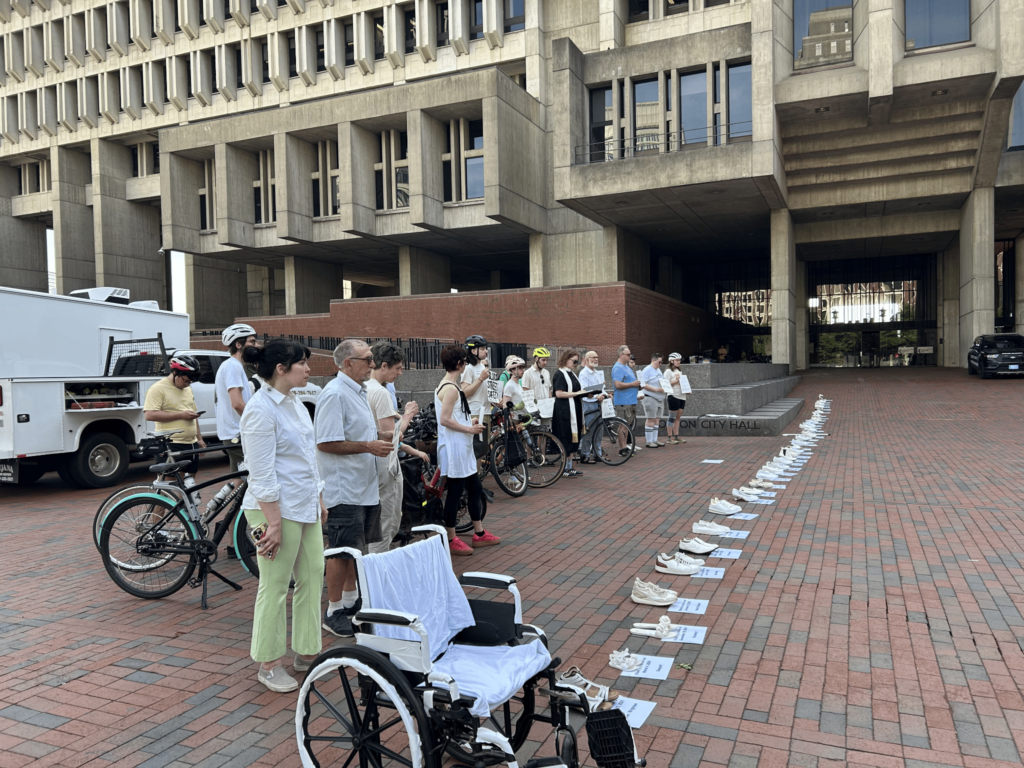
Laid out on city hall plaza were pairs of white shoes in a long line, one pair per fatality. Each pair of shoes had a sign indicating the date and the neighborhood where a person had been killed. In addition, a wheelchair draped in white cloth symbolized the multiple wheelchair users who have also been killed in traffic. Reverend Laura Everett held a moment of silence for all these losses. She then called us to action, gesturing to City Hall, urging us to demand an end to future tragedies.
While the 38 deaths we mourned are far too many, we realized after planning the event that even this high number is an undercount.
Introducing the Massachusetts Crash Map
CLICK HERE VIEW THE BCU LABS INTERACTIVE CRASH MAP
The true toll of traffic violence is even higher than the 38 deaths we mourned in May; our research shows 63 deaths of vulnerable road users to date since Mayor Wu took office. The mission of BCU Labs is to draw insight and tell stories with the wealth of available data, and we’ve been building tools to accomplish this (for example, the BCU Labs Stress Map was created to help guide your rides via the calmest routes across the Boston region). Our goal with the launch of the BCU Labs Massachusetts Crash Map is to help sharpen your activism.

With this map, you can easily visualize where crashes happen: within your neighborhood, city/town, or even across the state. Once we can start to see these patterns or problem areas appear as hotspots on the map, we can use these visuals to speak up and advocate for change.
This initial release of the map pulls crash data from the Massachusetts Department of Transportation, currently the most comprehensive public source available. Later this summer we hope to expand the map data to include additional crashes reported by selected municipalities, which do not always appear in the MassDOT data.
Using this interactive map you can:
- Select one of 5 regions to investigate crash data
- Boston metro
- Central
- Northeast
- Southeast
- Western
- Zoom out for a broad view of “hotspots” using the heat map display.
- Click on individual map points for details on crashes.
- Filter the map by date range, types of travellers, or severity of injury.
- Once you’ve set a filter and zoomed in, copying the link in your browser allows you to share this specific view (location, zoom level, data layer) with others to call out trouble spots and target your advocacy.
What did we learn building this map?
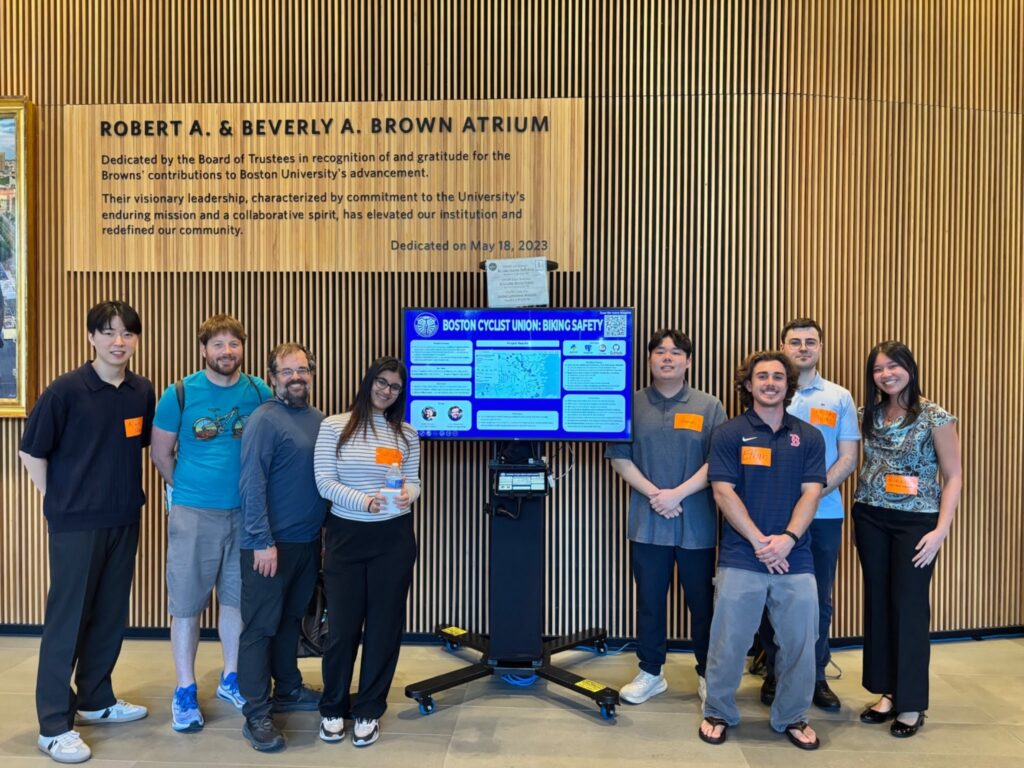
BCU Labs created the crash map in collaboration with Picturedigits and a team of undergraduate data science students from Boston University Spark!. The BU Spark! team wrote Python code to download and pre-process public crash data to be displayed in the map. For example, MassDOT collects crash reports filed by state and local police officers across the state, who use forms with more than 20 different labels for various types of vulnerable road users. We grouped these labels into three broad categories, based on their general speed:
- slow-speed vulnerable users, such as pedestrians and people using wheelchairs
- medium-speed vulnerable users, such as bicyclists, skaters, and non-motorized scooters
- higher-speed vulnerable users, such as “motorized bicyclists” (as defined by MA General Law) and “other” users who do not neatly fit into categories above (such as trolley/train passengers)
(Learn more about data, definitions, and disclaimers in the Map Crash Map repository on GitHub.)
While working on the crash map data, we discovered that public data sources do not necessarily report the same crashes, meaning that total fatalities are higher than we understood from the Boston Vision Zero database when planning the Ride of Silence. When we compared Boston Vision Zero data to the MassDOT Crash Impact database, we found that they reported different numbers of crashes that included fatalities.
When we narrowed our search to fatal crashes involving vulnerable roadway users in Boston from 2021 to May 20, 2026, we found that MassDOT reported 55 incidents, while Boston Vision Zero reported 44 incidents. Looking more closely, we found 20 fatal crashes with vulnerable users in the MassDOT data that did not appear in Boston Vision Zero data, and 8 fatal crashes with vulnerable users in the Boston Vision Zero data that did not appear in the MassDOT data.
When we combined the MassDOT and Boston Vision Zero data and removed likely duplicates, we found a grand total of 63 fatal crashes involving vulnerable users in Boston from 2021 to date, far more than the 38 fatal crashes we initially counted when organizing the Ride of Silence event. These discrepancies taught us that currently neither the city nor the state’s data alone tell the full story of fatalities of vulnerable road users in the City of Boston. For our next iteration of the Crash Map we plan to merge additional data sets into the map to show a more complete view of the crashes across the Commonwealth.
How can we achieve zero traffic deaths?
These small steps – a public memorial for victims of traffic violence, and building a complete and accurate crash map for Massachusetts – are in service of generating greater change to address and ultimately end road deaths.
People who use bikes in the Boston area know that safety is more than dots on a map. Safe infrastructure allows all of us to arrive alive. Other Bostonians won’t choose biking as a transportation mode given the current incomplete network. To make matters worse, starting in 2025 Mayor Wu began removing all vertical delineators that had been installed to create physical separation between bike and car lanes, leaving existing lanes blocked by drivers, or worse. Three years after a revised Vision Zero Action Plan, Mayor Wu refuses to act to improve safety on deadly corridors like Hyde Park Avenue.
Traffic violence is a public health crisis that affects all of us, with both a high personal cost and a shared societal cost (estimated to be 5 billion dollars annually in Massachusetts). Now 4 years from our Vision Zero deadline of 2030, traffic crashes and deaths in Boston remain stubbornly high, along with the economic and social costs of traffic violence. Every dot on the map is a life affected or ended by traffic violence. By implementing traffic calming and creating “complete streets”, every life saved is a story that gets to continue.
After the 2025 Ride of Silence, known as “Gracie’s Ride” in memory of 4 year old Gracie Gancheva killed by a pickup truck driver in the Seaport, Boston Cyclists Union recommended that Boston adopt the Strong Towns “Crash Analysis Studio” framework. This framework elevates a crash to a systemic failure and an opportunity to analyze and address the factors that led to the crash or death, in order to prevent future crashes of this type, at this location.
Vision Zero is an achievable goal. Somerville has gone 3 years without a traffic fatality. Prevention becomes a virtuous cycle. Traffic calming and crash prevention pay for themselves, including the incalculable cost of the lives we save. Cities that achieve Vision Zero take responsibility for crashes and dedicate themselves to a future without repeated, predictable deaths, rather than hiding behind the word “accident”.
Using BCU Labs’ Massachusetts Crash Map we can see the dangers – on our block, along our commute, or near our children’s schools – and then we can push the city to take action to prevent them.
Join us to work for change!
BCU Labs is a volunteer driven organization – JOIN US TODAY and contribute to projects like this or create new ones of your own! You can support our parent organization, the 501c3 Boston Cyclists Union with a one time or monthly donation. It’s also easy to volunteer with us!
We have made the Massachusetts Crash Map an open source project so you can explore our code or create your own state-wide or regional crash map. Feel free to contact us with any technical questions.