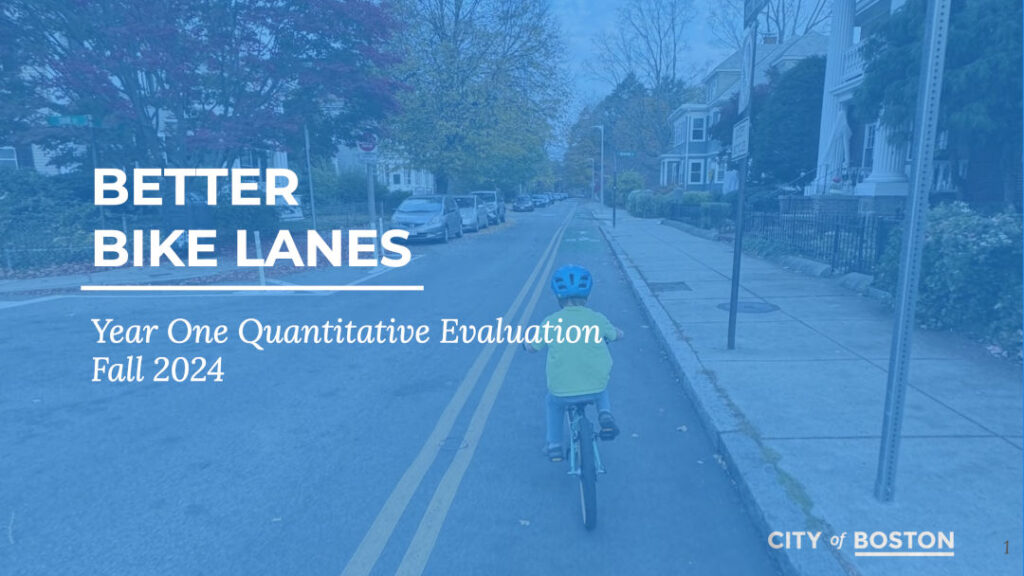
Bike Lanes WORK: 2025 Better Bike Lanes Report
This week, the city released a quantitative evaluation of the results from completed Better Bike Lane projects. Given the recent announcement of a “30-day review” of safety and transit improvements, we have an opportunity to see the data that representatives will review as they work towards achieving the goals of Vision Zero Boston- the commitment to focus the City’s resources on proven strategies to eliminate fatal and serious traffic crashes in the city by 2030.

What is the Better Bike Lanes Project?
The better bike lanes project focuses on safer streets for all. Projects include separated bike lanes on arterial streets to improve safety and comfort, two-way bike lanes on one way streets to create direct routes, and speed humps to improve safety on streets where drivers tend to use a heavy foot.
What is this data?
Speed and volume data was collected on streets for 7 Better Bike Lane projects and nearby control streets. The report compares data from before (2022) and after (2024) the street improvement project. Data was collected on mid-week dates in September that represent typical traffic conditions.
What questions does the data answer?
The data tells us that separated bike lanes, contraflow bike lanes, and speed humps reduce dangerous speeding and increase the number of cyclists without impacting car volumes.
1) Does the new infrastructure encourage cycling?
Absolutely! Bike counts increased 44% on average across the 7 projects. These positive results are not due to the overall increasing trend of cycling, as the unaltered control streets saw decreases of 3%.
2) How do two-way bike lanes on one-way streets impact cycling?
Contraflow bike lanes increased cycling in the with-traffic direction by 51% and increased overall cycling volume by 118%! Contraflow bike lanes encourage cycling by creating direct routes and improving access.
3) How do better bike lanes impact speeding and improve safety?
The risk of severe or fatal injury for a pedestrian struck by a driver decreases 30% when speed decreases from 30 mph to 20 mph. The Better Bike Lane project streets increased compliance with 25 mph speed limits by 15% across all projects, including streets without speed humps. Projects with speed humps saw the biggest improvements. Elliot Street (Jamaica Plain) and Poplar street (Roslindale) saw 95th percentile speed decrease from 33 mph to 23 mph after the introduction of speed humps. Overall, this data tells us that bike lanes and speed humps increase safety for drivers, pedestrians, and cyclists alike. Implementing the strategies from the Better Bike Lane project across the city can effectively eliminate cars speeding down your residential street.
4) How did Better Bike Lane projects impact drivers?
In addition to the safety improvements that benefit all road users, vehicle volume data showed little to no impact. Better Bike Lane Projects saw an overall vehicle increase of 1% while control streets saw an increase of 0.3%. This means the same number of driver’s completed trips on these streets.
Want to get involved?
What streets do you think could be improved in your neighborhood that could have similar neighborhood-wide effects? BCU Labs is always looking for curious minds who want to explore data-backed biking stories around Boston. We strive to find and advocate for the most effective ways to improve biking in the region. If you have any ideas of projects you’d like to see, stories told, or just to help, here is our Interest Form.
