BCU Labs Launches Bike Stress Map
Intro to BCU Labs’ Bike Stress Map
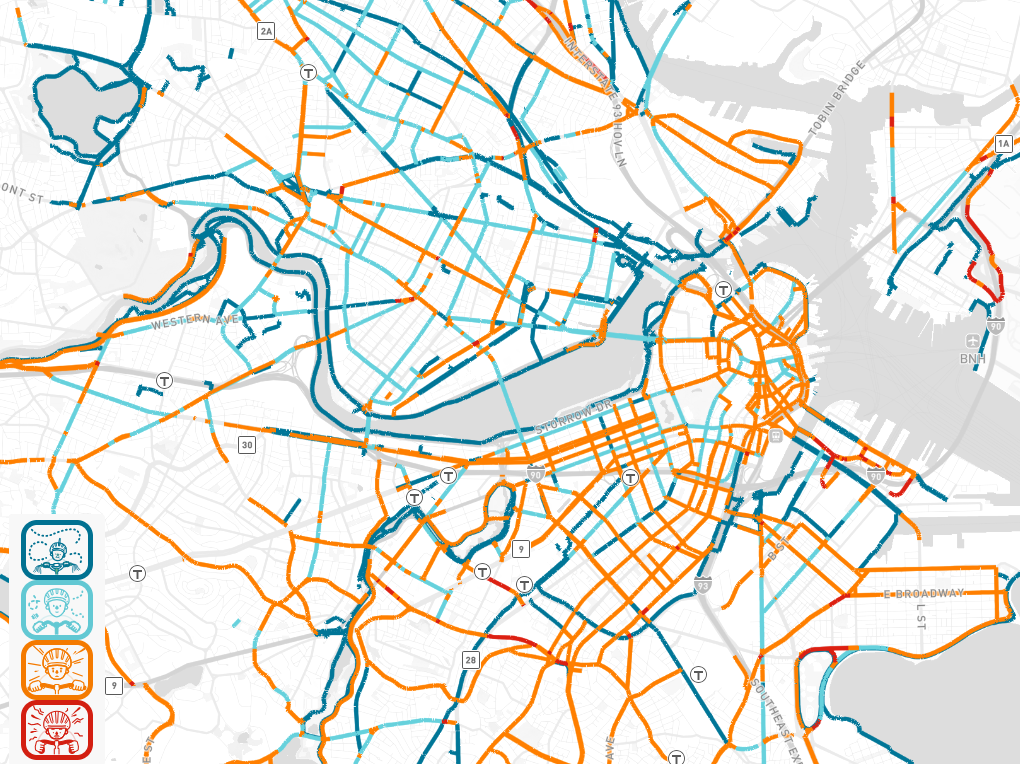
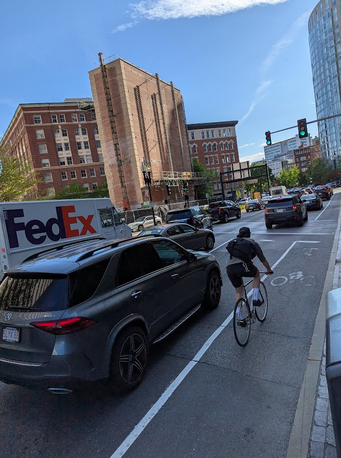
BCU Labs is excited to unveil our Bike Stress Map. This is a tool that helps viewers to better understand how people riding bikes or other personal mobility devices likely experience stress caused by automobile traffic while traveling through the city.
With this stress map, we aim to:
- Help provide the vocabulary to communicate your experience biking in Boston
- Show people alternative routes that may be lower-stress
- Highlight gaps in the network that could be candidates for improvements
The Bike Stress Map is our first project, rating every street in Boston, Cambridge, Somerville, and Brookline based on how comfortable it is to ride a bike on.
How to use the Bike Stress Map
Basic Functionalities
- Zoom in and out by scrolling (similar to Google Maps)
- Click on a street to see its rating, and details on infrastructure that exists there
- In the bottom left of the map, click the icons to understand more about each stress rating
There are many ways you can use this map. To start, we recommend exploring your neighborhood and places you are familiar with, like your commute.
Once you are comfortable with the tool, explore less stressful routes to your favorite destinations, plan trips to new ones, or identify a need to advocate for specific streets to be improved that would make your journeys better.
What is Level of Traffic Stress?
Anyone that has ridden a bike knows that just having a bike lane on a street does not mean it is comfortable to ride there – there could be cars whizzing by at 50 miles per hour with just a line of paint between you and the cars. On the other hand, riding on a low-traffic residential street can feel comfortable even without a marked bike lane. Unfortunately, if you look at a tool like Google Maps and turn on the biking layer, all it shows you is where there are bike lanes. With this in mind, Northeastern University professor Peter Furth came up with a system called “Level of Traffic Stress,” LTS for short, which he and his colleagues have developed as a way to help both cyclists and transportation planners.
LTS takes into account many attributes of a street that affect how comfortable people find riding a bike actually is. These attributes include: average volume and speed of cars, the level of separation between bikes and cars, whether the road is one-way or two-way, and whether there is street parking. More information on their criteria is available on Peter Furth’s website.
On BCU Labs’ Bike Stress Map, we’ve used the same rating system Furth and colleagues use, to identify roads as LTS 1 through LTS 4, where LTS 1 is “Carefree” for most riders, and LTS 4 is a stressful “White Knuckles” ride.
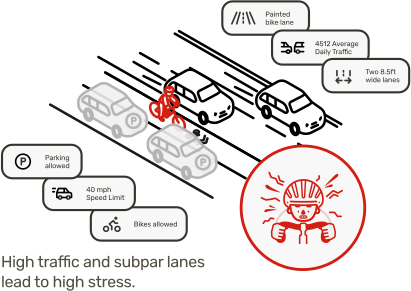
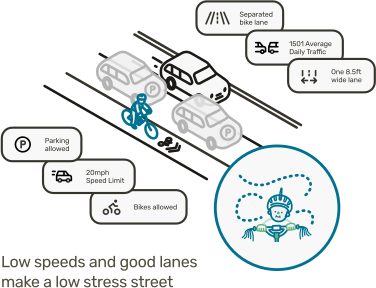
In general, most adults would be comfortable riding on streets rated LTS 1 or 2, and only the most hardcore riders will regularly brave streets rated LTS 4. This is critical to understand why in some areas you only see young and fit riders on fast bikes, while in other areas you see families riding together.
Technically, how are we doing this?
With our first release, all of our data are coming from OpenStreetMap. This is a great open dataset that gives us detailed information on street attributes. However, it is also limited, both in completeness and in the type of data that are included. This means that we have made educated assumptions where tags are not included for a given street and for the critical attribute of motor vehicle volume used in the LTS calculations. You can learn more about the specifics of what data we use from OpenStreetMap here, including some recommendations on how to improve the data if you find anything that is wrong.
Want to help us?
BCU Labs is building tools like this one to further the quality of safe streets advocacy in Greater Boston, drawing insights and telling stories from the wealth of data and passion available to and within the community. If you want to help us in any way, we would love for you to join us.