If you build it, they will bike!
This article is a part of our new regular series on bike data from our volunteer-led team BCU Labs. The team strives to use biking data to advocate for the realization of mobility justice in Boston. Safe design where it’s needed most! Learn more about the group at the end of the article!
How big of an effect does a small section of a high quality bike lane have? It turns out, a lot! Some cities have more than DOUBLED bike ridership throughout a whole neighborhood just by improving a single street. This result is promising for how safe streets and bicycle advocates and cities can install projects that have outsized benefits to the neighborhood around them.
Today we are going to explore a specific project recently completed in Cambridge. We will see how much biking increased within (at least) a half-mile of this project and how it started to change how people travel within their neighborhood.
Garden St, Cambridge
In November 2022, Cambridge made a significant change to a half-mile section of Garden St. As a project of the Cycling Safety Ordinance (CSO), a law that requires the city to build 25 miles of separated bike lanes by 2026, the city significantly upgraded Garden Street. From having door-zone bike lanes and sharrows, Garden St. was given fully separated bike lanes in both directions. To achieve this change, the city initially proposed removing street parking from one side of the street, but at public meetings, residents proposed an alternative: keep most of the parking, but convert the street to be one-way for cars. As this was a significant change, the city performed numerous traffic counts before and after the project was installed, both on the modified section and throughout the neighborhood surrounding Garden Street. Luckily for us, this means we can take a look at how many more people bike when the city builds safe bike lanes for them to ride in.
And the numbers are incredible! After just four months, even into the heart of winter, bike mode share on residential streets within a half-mile of the project increased by 300% and bike volumes increased by over 500%. And it’s not just on Garden St., but all the streets around it. Having just one major safe biking link added to the network opened up the possibility for local residents to feel safe and comfortable biking. It’s clear that residents are excited to have these lanes installed based on their actions.
Now of course biking is going up all around Cambridge, representative of all the city’s great efforts, but that’s where data plays a role. Comparing Bluebikes ridership data in Cambridge during the same time, we can get an idea of baseline bike ridership. And yet, there is still a huge spike in ridership in the area around Garden Street, compared with Cambridge overall!
There is clearly demand by residents to bike more, they are just waiting for safer streets, like the improved Garden Street. The City has been incredibly smart in focusing on major connections to allow people to get from home to work and pleasure. This focus has clear effects on the local streets surrounding them due to residents feeling safer biking to where they need to go.
On a personal note, I have been bike commuting daily for years. Previously, I avoided Garden Street due to not feeling safe, opting to take a much more circuitous route to work. With these changes, I happily simplified my commute, taking the much safer Garden Street.
Let’s take a closer look at the data
In this first chart, we can see the city took traffic counts before and after the installation of safe, separated bike lanes on Garden Street. The green line shows the total number of bikes counted across all counting locations. The grey line shows the baseline of bike ridership in Cambridge, using Bluebikes rides that started or ended in Cambridge and the counts from the bike counter on Broadway. All values are the relative increase to the counts on the first set of counts before the installation.
We can see how the October (just before installation) and December (just after installation) counts around Garden Street follow closely to the baseline of bike ridership in Cambridge. This is expected, as it can take people some time to change their travel habits when the streets change. But the following counts through the winter months show major increases to how many people are biking near Garden Street, while the baseline ridership (using Bluebike ridership and Broadway EcoCounter count data) in Cambridge shows what we would expect of lower ridership in the winter than the fall.
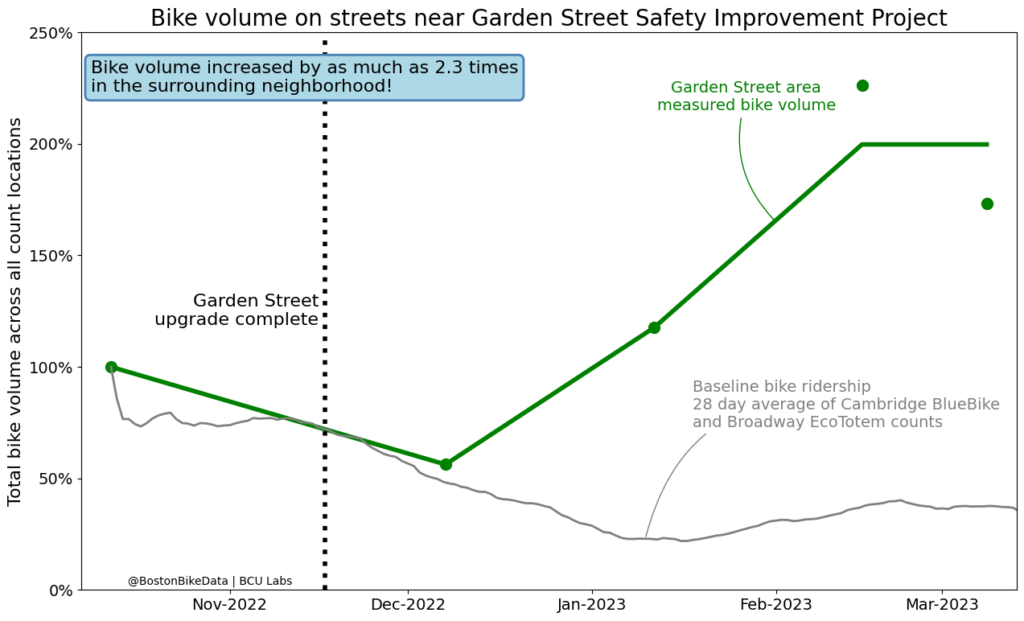
Seeing this increase in bike ridership happen in spite of the seasonal winter trends, we can conclude the effect from the Garden Street project is actually greater than the simplistic before and after ridership changes shown above.
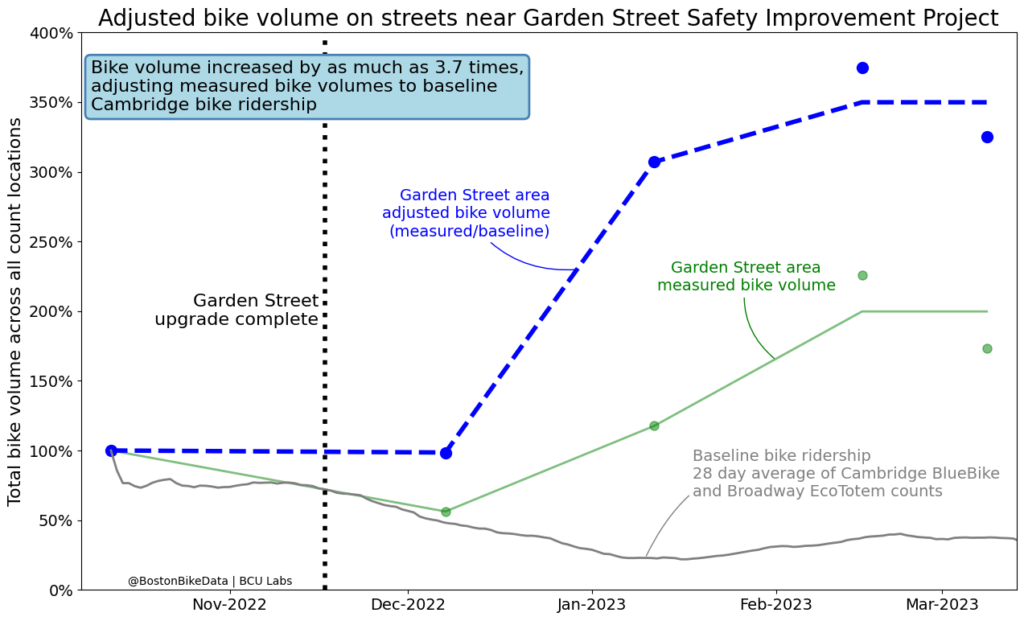
Dividing the measured bike volume by the baseline ridership, we can calculate the seasonally adjusted results of this project. The next chart is the same as above, with the added blue dashed line showing the seasonally adjusted measurements. We can see the real effect of this project is not just doubling bike ridership, but nearly quadrupling bike ridership!
We can conclude that people would like to ride bikes for more of their trips but are held back much more by poor infrastructure than weather.
Improving Networks
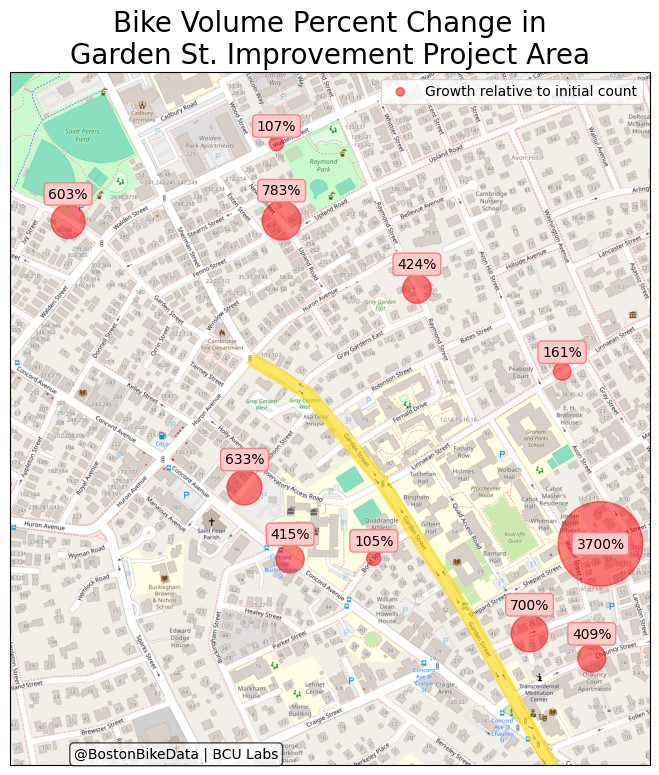
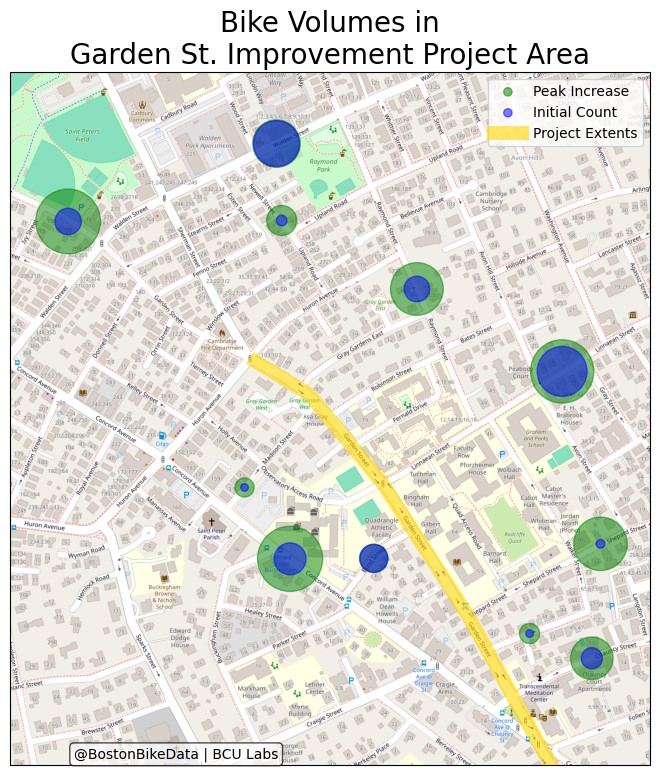
We have been talking about the overall effects of this project on ridership throughout the neighborhood, but it is helpful to see where the data was actually collected and what section of Garden Street we have been talking about. Below are a pair of maps that show this and different ways to see what changes in bike ridership each counting location saw. For both maps, a larger dot means the number is larger.
On the left map (“Bike Volume Percent Change…”), the red dots are scaled with the percentage growth seen at that count location.
On the right map (“Bike Volumes in Garden St…”), the blue dots show the number of bikes in the count before the project was installed and the green dots show the counts after the project was installed.
Reducing Driving (a.k.a. reducing traffic!)
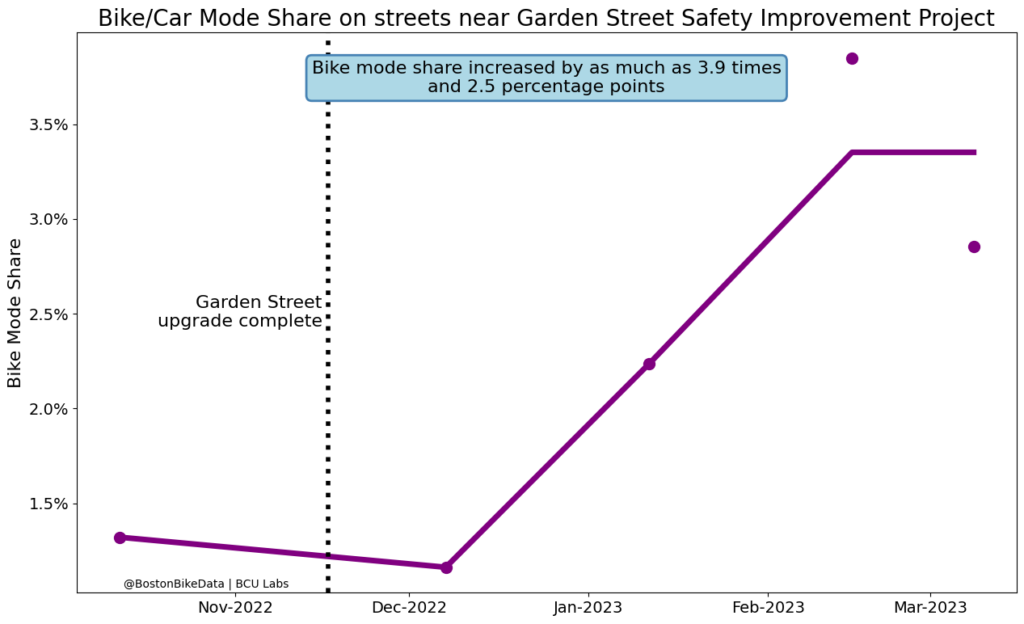
The City of Cambridge has numerous related goals to reduce driving and increase biking in the city, including: 2016 Vision Zero, Bicycle Plan 2020, 1992 Vehicle Trip Reduction Ordinance, 2016 Complete Streets Policy, Safe Routes to School, and Cycling Safety Ordinance. To measure how well they are doing towards reaching their goals and how much specific projects are helping, the city can’t just look at how many people are biking, but also how many people are driving. To make useful comparisons, the city uses a metric called mode-share. This is the percent of people traveling using a specific mode (e.g. bike or personal car) compared to the overall number of trips. Within the traffic count data, we can calculate a mode share of bikes and personal cars and how this project has changed the rate of people biking compared to people driving. This shows how people are changing how they travel. As shown in the graph below, the bike/car mode-share increased 2.5 percentage points and nearly quadrupled. Such a simple change to our streets really can encourage people to drive less and bike more, people just need to feel safe from cars to make that choice.
Want More?
What streets do you think could be improved in your neighborhood that could have similar neighborhood-wide effects? BCU Labs is always looking for curious minds who want to explore data-backed biking stories around Boston. We strive to find and advocate for the most effective ways to improve biking in the region. This post is an adaptation to one of our member’s Mastodon and Twitter threads, and we want to bring this type of analysis to Boston. If you have any ideas of projects you’d like to see, stories told, or just to help, here is our Interest Form.